
When working with biometric systems, we often face a huge misconception about their performance:
Clients expect these systems to provide an unambiguous result.
In terms of face biometrics, this expectation translates into a clear yes-or-no answer about whether two submitted images depict the same person or not.
As always, the reality is more complex. To tackle this issue, it's important to understand how biometric systems work and their basic performance metrics. This topic isn’t the easiest, but let’s break it down together.
The basics of face match
Face match technology compares two portraits to assess how similar (or not) the faces on them are. The result of this comparison is a metric, often also called a "value," "distance," or "score."
Think of the images as points on a graph. The metric represents the distance between these points: the closer they are, the more similar the faces.

The only thing left to figure out is how far apart the points should be to decide if it’s the same person in the two photos or not.
To do this, you need to compare pairs of images—examples of matched and non-matched faces—and see the distances between them. Since billions of human faces exist, you need a huge amount of examples to train your system and get credible results. Suppose, you have everything needed; then, you’ll typically get results in a graph like the one below:
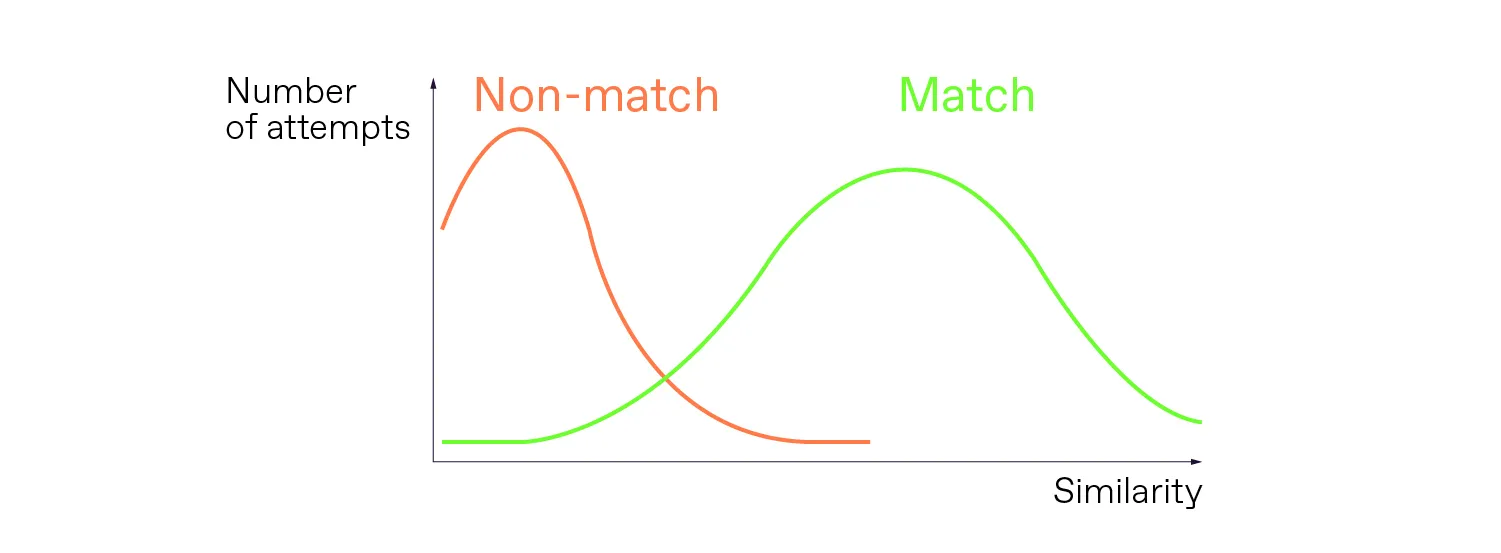
The genuine attempts, where an individual is matched against their own photo, are marked in green. The attempts with non-matching faces are marked in orange.
You see two bell curves. The genuine attempts, when an individual is matched against their own photo, are marked in green. The attempts when faces don't match are marked in orange.
Have you noticed anything peculiar about these two bell curves?
Exactly! They overlap.

The challenge is that the orange curve goes pretty far into the green one, and vice versa. In fact, you can't draw a line so that one side includes only “green” attempts, and the other side includes only “orange” attempts.
As a result, the system’s output provides only a certain degree of confidence, which means that an error is possible. So, the decision comes down to what chance of error is acceptable.
Get posts like this in your inbox with the bi-weekly Regula Blog Digest!
Metrics for evaluating the performance of face match
The natural question is, “How do I figure out what chance of error we're talking about?” To answer this question, there are a couple of conventional metrics for measuring the performance of biometric systems:
FMR (False Match Rate): The proportion of impostor attempts that are falsely identified as a match.
FNMR (False Non-Match Rate): The proportion of genuine attempts that are mistakenly identified as non-matches.
It’s important to keep in mind that these metrics are a trade-off. They are interdependent, meaning that it is impossible to get a random pair: choosing one determines the value of the other, and vice versa. Besides, we have seen in the chart above that the intersection of the green and orange zones is quite wide, so we can have many different pairs.
So, for convenience, there’s a popular way to visualize and evaluate the FMR/FNMR results of different biometric solutions:
- DET (Detection Error Tradeoff): A graph that shows the correlation between FMR and FNMR. When comparing systems, the more accurate one will have a lower FNMR at the same FMR level.
.webp)
A DET graph of face recognition technology evaluation.
At this point, a fair question would be, “If performance metrics exist, why not simply compare them and pick the solution that shows the best results?”
But it’s not that simple.
Biometric system performance is tied to a dataset
The metrics heavily depend on the databases you use for testing: you get them by comparing a large number of pairs, and the overall result strongly depends on specific pairs. So the takeaway here is that you can't compare performance metrics obtained from different datasets.
Here’s a true story from our experience:
A customer wanted to choose the best face match solution available. They got test results from two vendors, each of whom provided the results obtained from their own datasets. Since the datasets were different, it was impossible to perform a clear side-by-side comparison of the two solutions. To solve the confusion, the customer contacted the National Institute of Standards and Technology (NIST) so they could compare the shortlisted solutions using a single dataset.
However, even this approach has its limitations. If a customer implements the winning solution, they might experience a completely different performance than what they saw during testing, because the real-world submissions from actual users don't match the specimens in the dataset that NIST (or any other organization) uses for testing.
This brings up another key point:
All tests are conditional and may not reflect your real-world scenario.
How to adjust system performance to your business case
Let’s go back to the DET curve for a moment. As you can see, different variants of FMR/FNMR combinations are possible. The targeted performance is achieved by setting an appropriate threshold.
The threshold determines at what degree of similarity the compared images are classified as matches or non-matches. A lower threshold prioritizes user convenience by reducing false rejections of genuine attempts. Conversely, a higher threshold focuses on security, minimizing false acceptances of impostor attempts.
The challenge is that using a raw similarity score to adjust the threshold is difficult. Let’s show, not tell.
Similarity Score vs. Similarity Rate
Say we’ve obtained some measurements on a test dataset and visualized them on a graph with scale values in steps of 0.1.

Someone adjusting the threshold might intuitively just move it by the next 0.1 scale step, expecting to double the effect. But here’s the tricky part. The segments on the scale are evenly spaced, but the number of items in each segment varies significantly. So moving the threshold one step right won’t necessarily double the effect because the graphs change at different rates.
This variability makes managing raw metrics difficult. Sometimes, a small change can drastically affect the system, while other times, a larger change has little impact.

Evenly spaced segments aren’t equal
To address this, biometric solution providers convert them into a more understandable format. This process is called normalization.
By normalizing the metric, we mean converting the raw measurements into a Similarity Rate, which is the artificial metric calculated as a percentage. However, this is necessary for more than just the convenience of a percentage over a string of numbers.
Normalization stretches the graph, making it more gradual, to level out these variations. Although the scale steps remain equal, some segments appear longer than others.
With normalization, adjusting the threshold by the same percentage consistently affects the system. For example, changing the threshold from 75% to 80% impacts the system the same way as changing it from 80% to 85%. Users can now better understand how the system responds to threshold changes, improving overall manageability.

With the Similarity rate, we change the method of calculation and stretch the axis to make fine-tuning the system much more predictable.
Here, you might notice that a normalized graph isn’t a silver bullet, because you might have different datasets for different scenarios. To address this, a vendor should consider all potential use cases. For instance, we at Regula have different datasets for pairs of images from IDs’ visual zones and electronic chips, and for pairs of images from a visual zone and a selfie.
So, how to choose the most effective face biometrics solution?
Choosing the right face biometrics solution is like picking the perfect car. There's no universal answer, and the best choice depends on your specific needs and conditions. Here's our advice:
Understand your needs: Like choosing a car, the best solution depends on your specific requirements. There's a wide variety of options, and what works perfectly in one use case might not work in another. A Porsche 911 and a Scania heavy-duty truck are both cars, but serve different needs, right?
Test on datasets relevant to your business case: When possible, use your own datasets to test and analyze performance. Ideally, try to test the systems in conditions that are most similar to your business case and real-world conditions. If this isn’t feasible, then select an organization that will help you evaluate the performance of different vendors on the same dataset that is relevant to your business. For example, NIST does such tests.
Set realistic expectations: Just like cars' performance varies depending on driving conditions, biometric systems perform differently depending on your specific use case and environment. Remember that no single test can predict exact performance.
Trial and adapt: Just like with cars, you have to adapt to the actual situation: drop the speed when turning, but accelerate when passing. So be prepared to adjust thresholds and settings to find the optimal balance between security and user convenience for your particular business, and remember that this isn’t a one-time action.
At Regula, we’ve done the groundwork to provide robust face biometric solutions that can be adapted and customized to a specific business case. Experiment, adjust, and find the best fit for your needs.
Ready to explore?
Test-drive our face biometrics solution today and see how it can meet your security and usability requirements.


