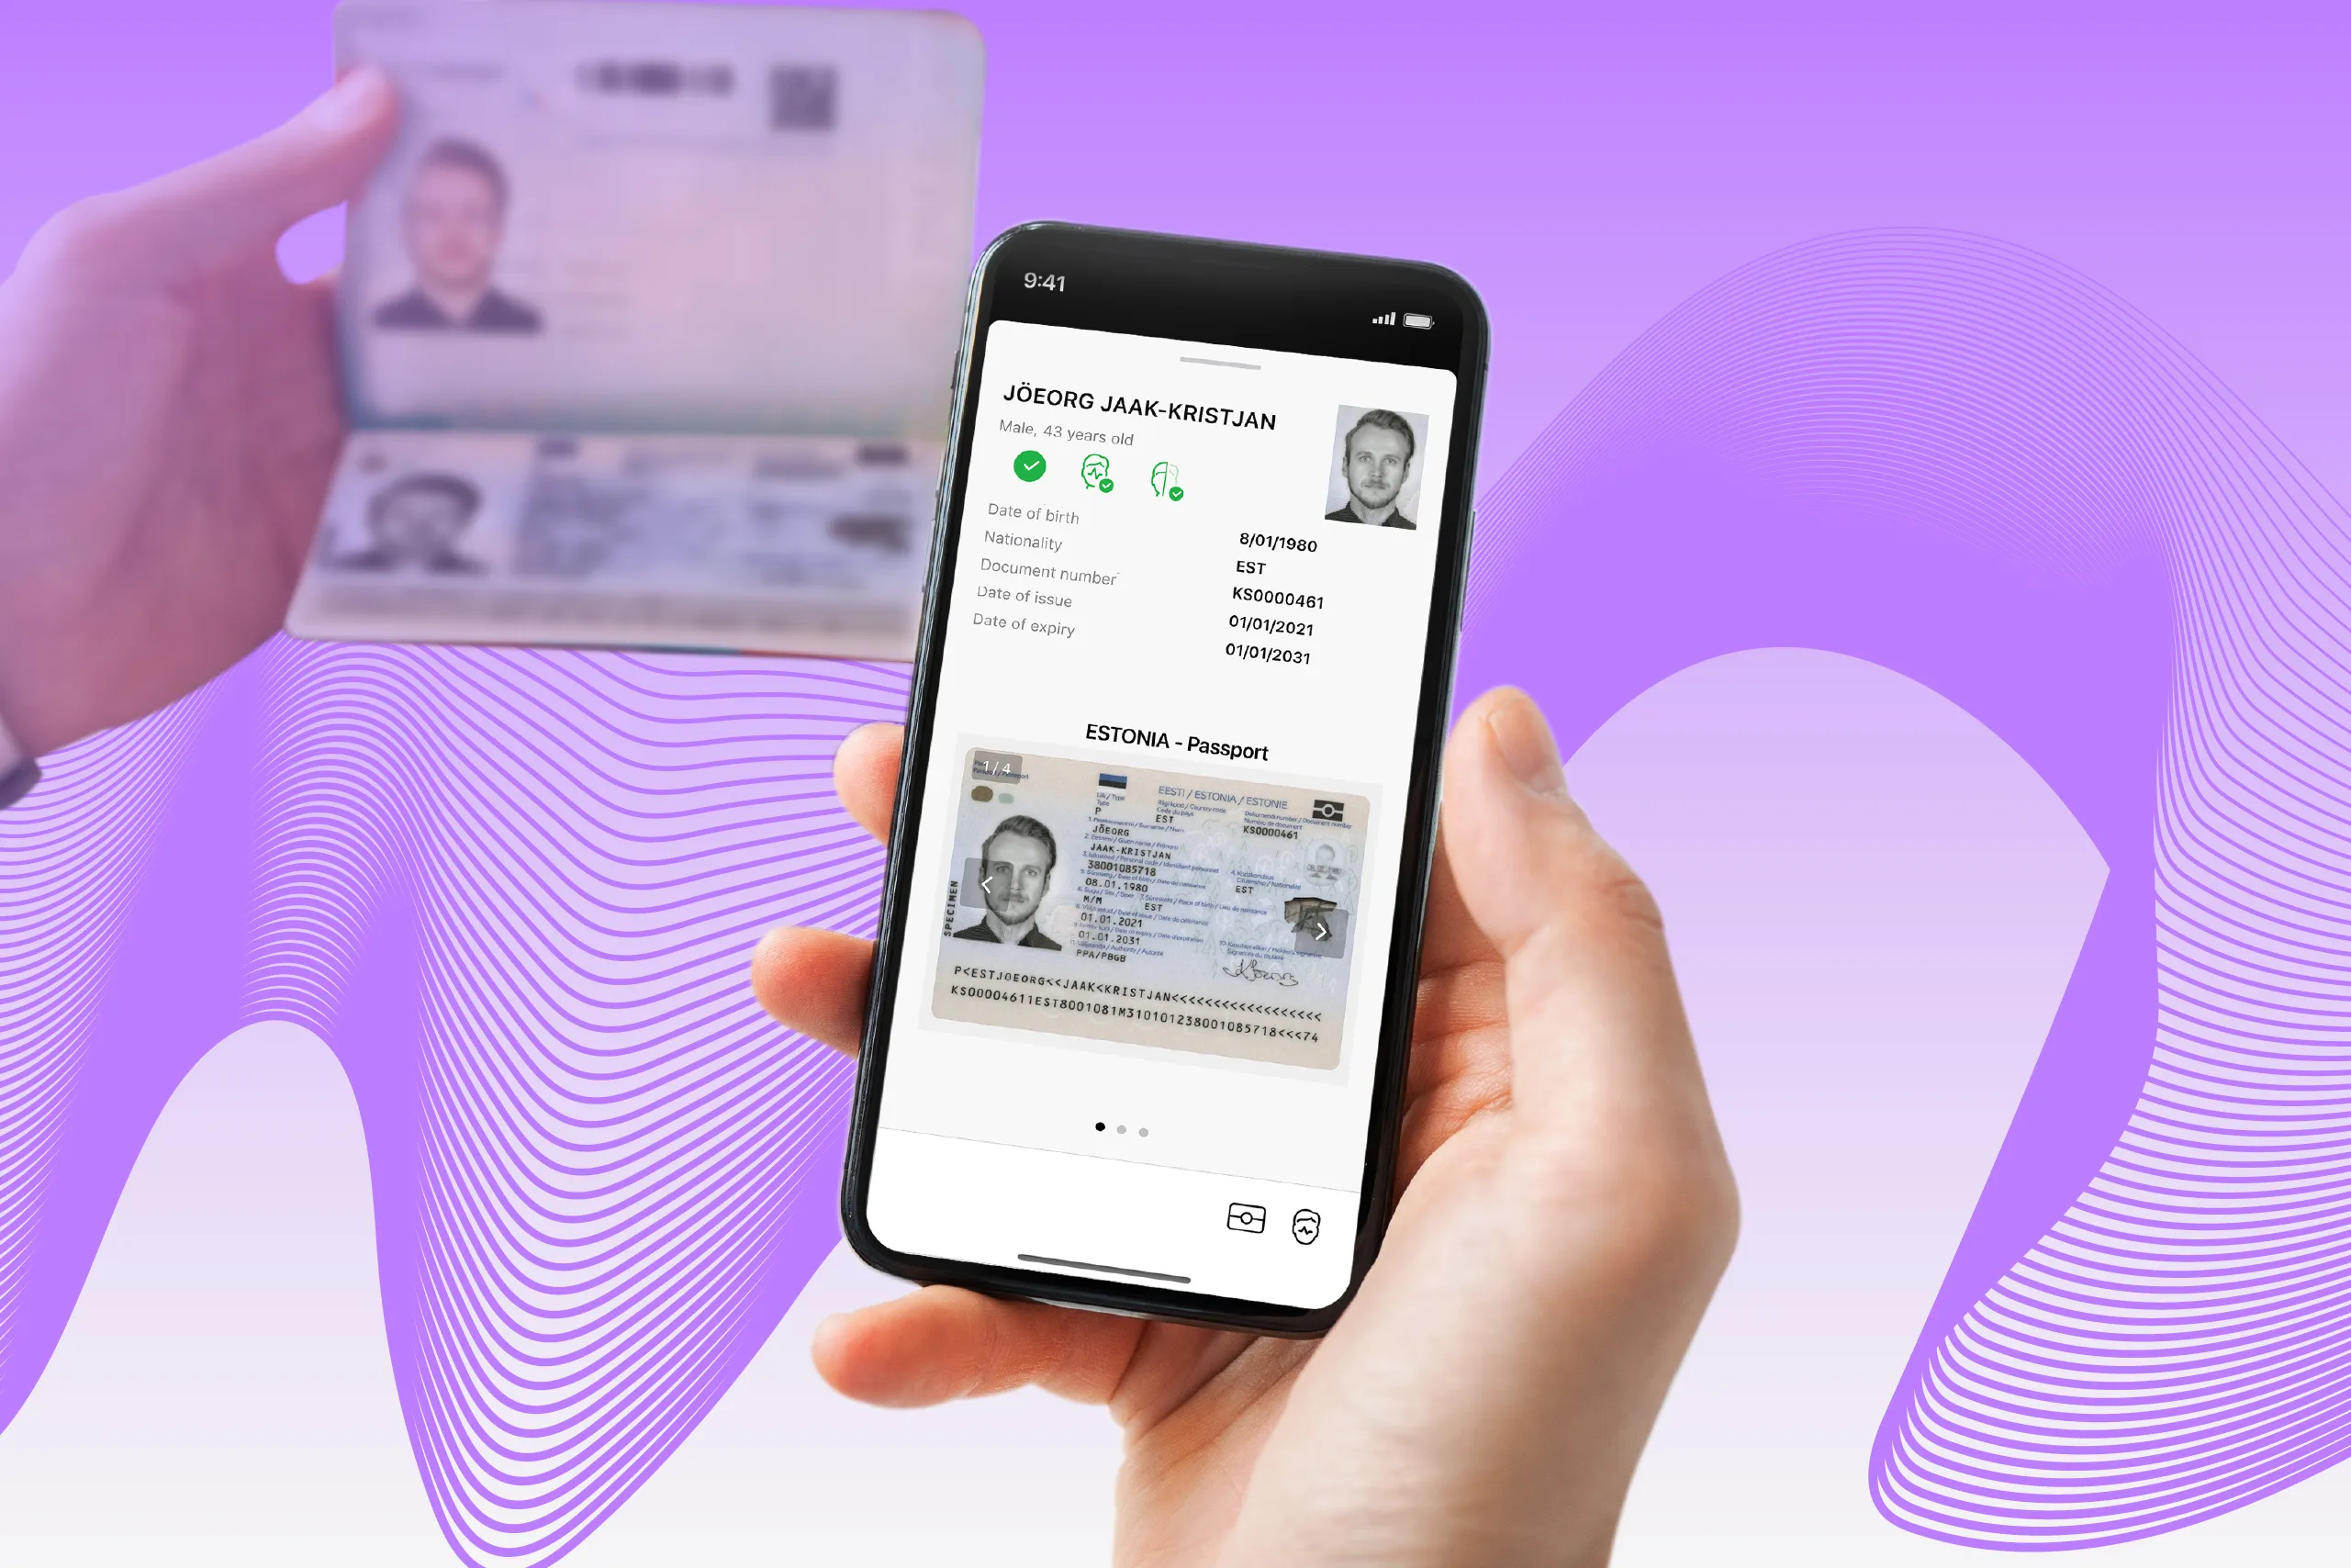

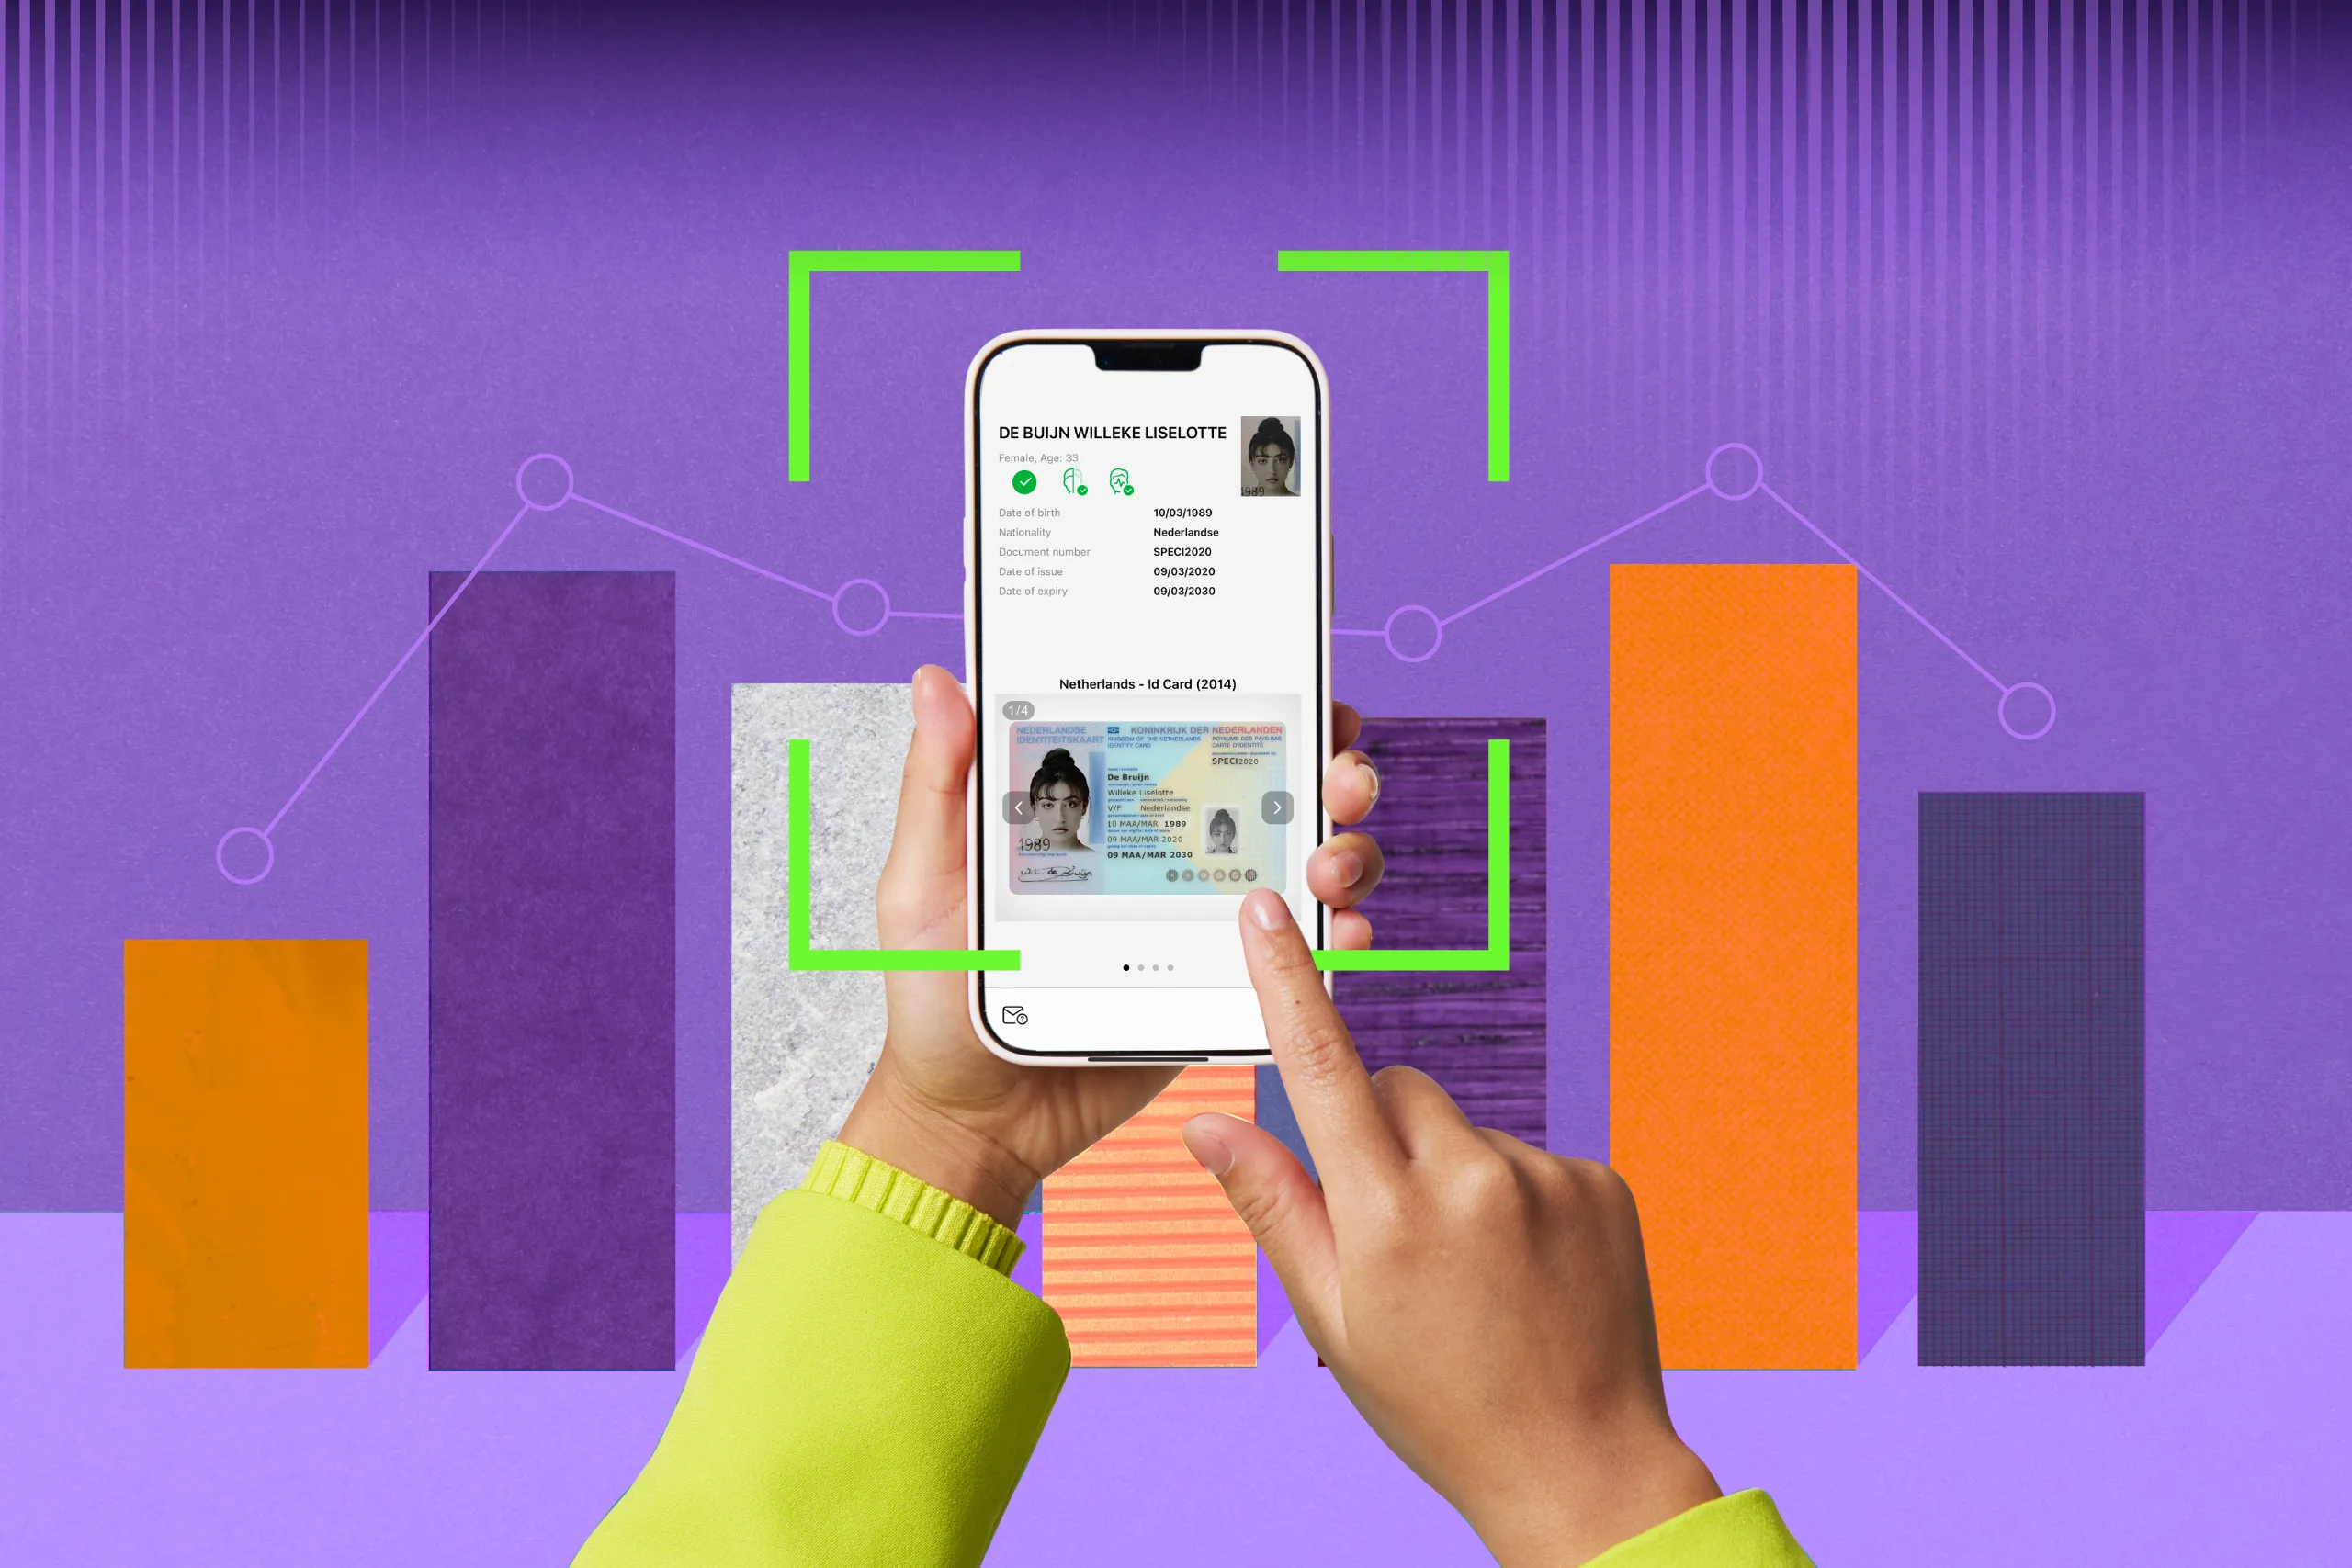
Which characteristics can be used to describe the reliability of an identity verification solution?
For example, a solution demonstrates 100% Optical Character Recognition (OCR) accuracy. The percentage of image retakes is as low as 0.9%, while a verification session takes mere seconds.
Do these arguments sound plausible?
On the one hand, numbers are always more convincing than words. For this reason, many companies trust the statistics when choosing identity verification (IDV) software.
However, it’s critical to understand how these identity verification metrics are calculated before relying on them entirely.
In this blog post, we’ll discuss commonly used IDV metrics, and reveal why it’s important to remain skeptical about any quantitative results associated with IDV performance assessment.
Key performance metrics in identity verification: A quick overview
At first glance, there are several methods to evaluate an IDV solution in quantitative terms. However, it’s difficult to determine an approach that acts as a gold standard for the industry. In real life, businesses and organizations have their own ways of measuring IDV software quality and accuracy.
In the identity and biometric verification field, there are various laboratories that provide product certification programs and evaluations for technologies used in device onboarding, face recognition, document authentication, etc.
The National Institute of Statistics and Technology (NIST) is an example of a laboratory with an objective view of biometric verification metrics. Equipped with a vast amount of diverse and well-prepared test data, NIST evaluates the accuracy of currently existing facial recognition algorithms and makes the results freely available to the public. However, as quality benchmarks intended specifically for developers, these metrics are hardly helpful for businesses looking for an effective IDV solution.
Other identity verification metrics can be categorized as follows:
ID document verification metrics: There are document-dependent and document-independent metrics. The former group is related to particular ID characteristics, such as type, quality, and security features. For example, these metrics may measure barcode reading accuracy or recognition accuracy for non-Latin scripts. The latter group describes the algorithm’s performance in different conditions, for instance, how the solution processes IDs scanned in a dark room or with a low-quality mobile camera.
Presentation attack detection metrics: This category describes the liveness detection accuracy that helps identify silicon masks, mannequins, AI-generated images, on-screen photos, video replays or injections, and more.
Biometric face matching verification metrics: The accuracy of biometric verification can be evaluated through false non-match/match rate, false negative identification rate, and many other indicators. Importantly, facial biometric metrics are frequently biased; for example, they may demonstrate better (or worse) results depending on a particular gender or nationality.
Usability and overall software performance metrics: These metrics evaluate the software from the user’s perspective. They show how user-friendly the solution is and whether it runs smoothly. They include the percentage of document image capture and selfie retake, check speed, pass rate, etc.
Security metrics: One of the main purposes of identity verification technology is to prevent fraudulent attempts to access your systems. Security metrics show the effectiveness of the software on this battlefield. This is a broad category that measures such things as fraud rate (the ratio of legitimate/fraudulent transactions) and many other metrics.
Total accuracy metrics: This category includes all accuracy results indicating the quality performance of each verification check, for instance, OCR. Therefore, it should stay apart from the other metrics.
Obtaining these metrics still doesn’t guarantee that you’ll make an informed decision.
First, the list we provided above is not exhaustive.
Second, you never know how all these values are calculated. And, importantly, it has nothing to do with the vendor's unwillingness to reveal its approach. The problem lies deeper.
Get posts like this in your inbox with the bi-weekly Regula Blog Digest!
How document assessment shapes metrics calculation
In identity verification, any metric is often a generalized category consisting of many other measurements. Often, a system combining numerous factors is used to evaluate the software's performance under different conditions. Any of these factors can turn an excellent metric into zero.
Let’s take an example to illustrate this idea:
A user scans their ID document with a mobile camera. The quality of the image submitted to the system is one of the key factors. In real life, this scan can be far from perfect. This impacts all the following checks since in the IDV flow, one thing leads to another. When processing a blurred, glare, or dark-lit ID photo, the software can’t correctly detect the document type, read the data in MRZ to run one of the protocols during RFID verification, recognize the barcodes, etc. As a result, a poor shot will mar all the metrics.

The dataset
During the test, the characteristics of the test dataset and the algorithms used for processing this data also matter. The dataset is the entire set of face images, document specimens, etc. used to test the solution and evaluate the verification accuracy.
Here are the main dataset characteristics that have an impact on the bottom line:
Size: The more items in the dataset, the more tricky (yet close to reality) the recognition task. The size of the test dataset should be large enough to proportionally reflect the specific characteristics of identity documents or customer selfies from your current flow. In other words, you need a truly representative sampling to properly measure the accuracy of checks. Otherwise, even software that passes the test drive with flying colors may fail in daily use.
Image quality: Since your customers typically scan their IDs and take their selfies in different environments, it’s crucial to check how the software processes images of different quality. For this reason, the dataset should include high-res, blurred, and darkened images. If your current verification workflow implies that all photos are taken in a controlled environment (i.e., you always obtain high-quality scans), you can ignore this point. Either way, the image sampling must be consistent with the actual photos you process.
Data diversity: The dataset must be diverse, containing different types and versions of identity documents (both newly issued ones and ones that have been in use for many years) in different languages, including non-Latin ones, and images of people of various nationalities, ages, genders, etc. Even if the identity verification system is intended to process domestic IDs, you can encounter foreign passports or driver’s licenses presented by customers from other countries, such as travelers or digital nomads.
Data completeness: The ID document templates in a dataset should be marked up in order to give a complete description of each text field and security feature. Furthermore, it’s better to separate IDs into categories based on the particular security feature you want to check. For instance, if you want to measure the accuracy of hologram verification, you need to compile a representative dataset of various IDs containing holograms.
When you test an IDV solution using only high-res photos from a single group of customers or IDs, the final scores can be excellent. However, even slight adjustments can break this well-oiled mechanism.
For example, IDV software that perfectly verifies German passports can show worse results with Austrian identity cards.
Now, let’s take a look at what happens on a deeper level.
The algorithm
Identity verification technology relies on neural networks to validate document authenticity. Many vendors also involve human agents in the process. This means that when assessing a vendor, you need to be very clear on whether manual checkers performed by employees are involved. Here, we’ll talk about the automation flow only.
IDV developers use datasets to train neural networks to perform these verification tasks. This process includes many iterations in which the size and diversity of the dataset are changed.
With each new update, neural networks gradually train themselves to generalize the specifics of particular object categories, such as “driver’s licenses,” “resident permits,” and “passports,” in order to correctly recognize and verify documents they “see” for the first time.
There are three datasets involved in algorithm training or machine learning (importantly, a standalone kit of datasets is required for each model):
The training set teaches a prediction model to solve a particular task, such as object classification. During the learning process, the model “observes” the training set in a prescribed order over and over again.
The validation set checks the model's performance by measuring interim results at the end of each training session.
The test set gives an objective evaluation (final metric) of the trained model, e.g., when it reaches a particular accuracy after many iterations. Since the test set includes images the model has never “seen,” it’s like a final exam. A “good” grade confirms the model is well-trained, while a “bad” grade points out imperfections and flaws to fix.
During the machine learning process, it’s critical to avoid any intersections between these datasets. Namely, the same image mustn’t be added to both the training and the test sets. Additionally, there should be a correct ratio between datasets in terms of data amount, quality, and diversity.
Otherwise, the final metrics will be inaccurate.
The challenge
Any metric strongly depends on which dataset(s) and algorithm(s) are used during the test. Every IDV vendor has its own inputs when measuring efficiency. For this reason, comparing the same metrics provided by different vendors seems counterintuitive.
Why are biometric verification metrics more reliable than ID document metrics?
Training neural networks used in facial recognition and verification is also a challenging task; however, it appears clearer from the start. People have human features, such as specific skin texture and facial characteristics, that help software distinguish them from other objects in pictures. After looking through thousands of portraits, neural networks can easily recognize and classify people by gender, nationality, or age.
By the way, there are the same mandatory components behind the process—a dataset, namely three ones, and an algorithm used to process it. To get clear results, the dataset must be diverse, comprising images of men, women, and children of different ages and nationalities. The disproportion of test images subsequently leads to bias in how biometric verification systems analyze people.
Additionally, you need “selfies” taken in different conditions to check how the solution processes darkened and blurry shots.
At the same time, developing reliable algorithms for recognizing identity documents is a continuous challenge for machine learning engineers.
Passports, identification cards, and driver’s licenses are issued under particular standards, such as the ICAO’s Doc 9303 for machine-readable travel documents, but they still lack distinctive features like human faces. From a machine-readable zone with different data formats to a variety of alphabets and security features, identity documents are far too diverse to be easily classified by neural networks.
IDV vendors frequently operate with a limited number of ID templates to compile large enough datasets to train neural networks to detect any document issued on Earth. Documents also get updates from issuing bodies that sometimes significantly change their characteristics, making this already difficult task more complicated.
All of this requires an in-depth knowledge of identity documents and their components from the IDV vendor to build a robust solution.
How to correctly assess an IDV solution using quantitative metrics
Now, we can safely say that IDV metrics may make false promises. However, that still doesn’t mean that you should ditch them while testing the performance of an IDV solution.
To get accurate results, you can compile a dataset considering your target audience demographics and the type of IDs you typically obtain from customers. This will help you get a test drive that’s closer to reality.
Typically, companies have two options for obtaining test data: accessing their historical data from previous IDV verification situations or using real data.
Unfortunately, the first method is mostly practical for enterprise-sized companies. Others may consider a pilot implementation to run tests on real data. In this case, it’s reasonable to roll out the solution for two or three months.
The primary goal behind the test process is to check if the solution helps complete daily verification tasks, which differ at various companies. For instance, organizations in Government or Banking typically have a more scrutinized verification flow compared to companies that provide basic services.
Specific customer needs and expectations also matter. While some companies have tech-savvy users, others target more traditional audiences who may have difficulties with active liveness detection or ID capture. This is why a perfect UX and seamless flow are among the most significant metrics to take into consideration.
It’s also important to test the solution’s performance on different platforms and devices (including older OS versions and low-end devices) to ensure that customers can access the service.
In conclusion
Quantitative evaluations work best when measuring the effectiveness of an IDV solution. However, it’s easy to get lost in the numbers since there is no single method for measuring performance.
Your best bet is to verify all the numbers on real or well-prepared test data and see how the solution performs in your specific usage scenarios.
At Regula, we carefully curate and analyze the metrics for our solutions: Regula Document Reader SDK and Regula Face SDK. Start a free trial or book a call with one of our managers to discuss pilot implementation and other details.